Elasticsearch
From https://www.elastic.co/products/elasticsearch:
Elasticsearch is a distributed, RESTful search and analytics engine capable of addressing a growing number of use cases. As the heart of the Elastic Stack, it centrally stores your data for lightning fast search, fine‑tuned relevancy, and powerful analytics that scale with ease.
Storage
All of the data Elasticsearch collects is stored under /nsm/elasticsearch/.
Warning
Do not manually delete any files in /nsm/elasticsearch! If you need to delete Elasticsearch indices, this should be done through Elasticsearch itself rather than deleting files from the filesystem.
Schema
Security Onion tries to adhere to Elastic Common Schema (ECS) wherever possible. In some cases, additional fields or slight modifications to native Elastic field mappings may be found within the data. You can learn more about ECS at https://www.elastic.co/elasticsearch/common-schema.
Querying
You can query Elasticsearch using web interfaces like Alerts, Dashboards, Hunt, and Kibana. You can also query Elasticsearch from the command line using so-elasticsearch-query.
Authentication
You can authenticate to Elasticsearch using the same username and password that you use for SOC.
You can add new user accounts to both Elasticsearch and SOC at the same time as shown in the Adding Accounts section. Please note that if you instead create accounts directly in Elastic, then those accounts will only have access to Elastic and not SOC.
Indexing
Most data is associated with a data stream, which is an abstraction from traditional indices that leverages one or more backing indices to manage and represent the data within the data stream. The usage of data streams allows for greater flexibility in data management.
Data streams can be targeting during search or other operations directly, similar to how indices are targeted.
For example, a CLI-based query against Zeek connection records would look like the following:
When this query is run against the backend data, it is actually targeting one or more backing indices, such as:
Similarly, you can target a single backing index with the following query:
You can learn more about data streams at https://www.elastic.co/guide/en/elasticsearch/reference/current/data-streams.html.
Configuration
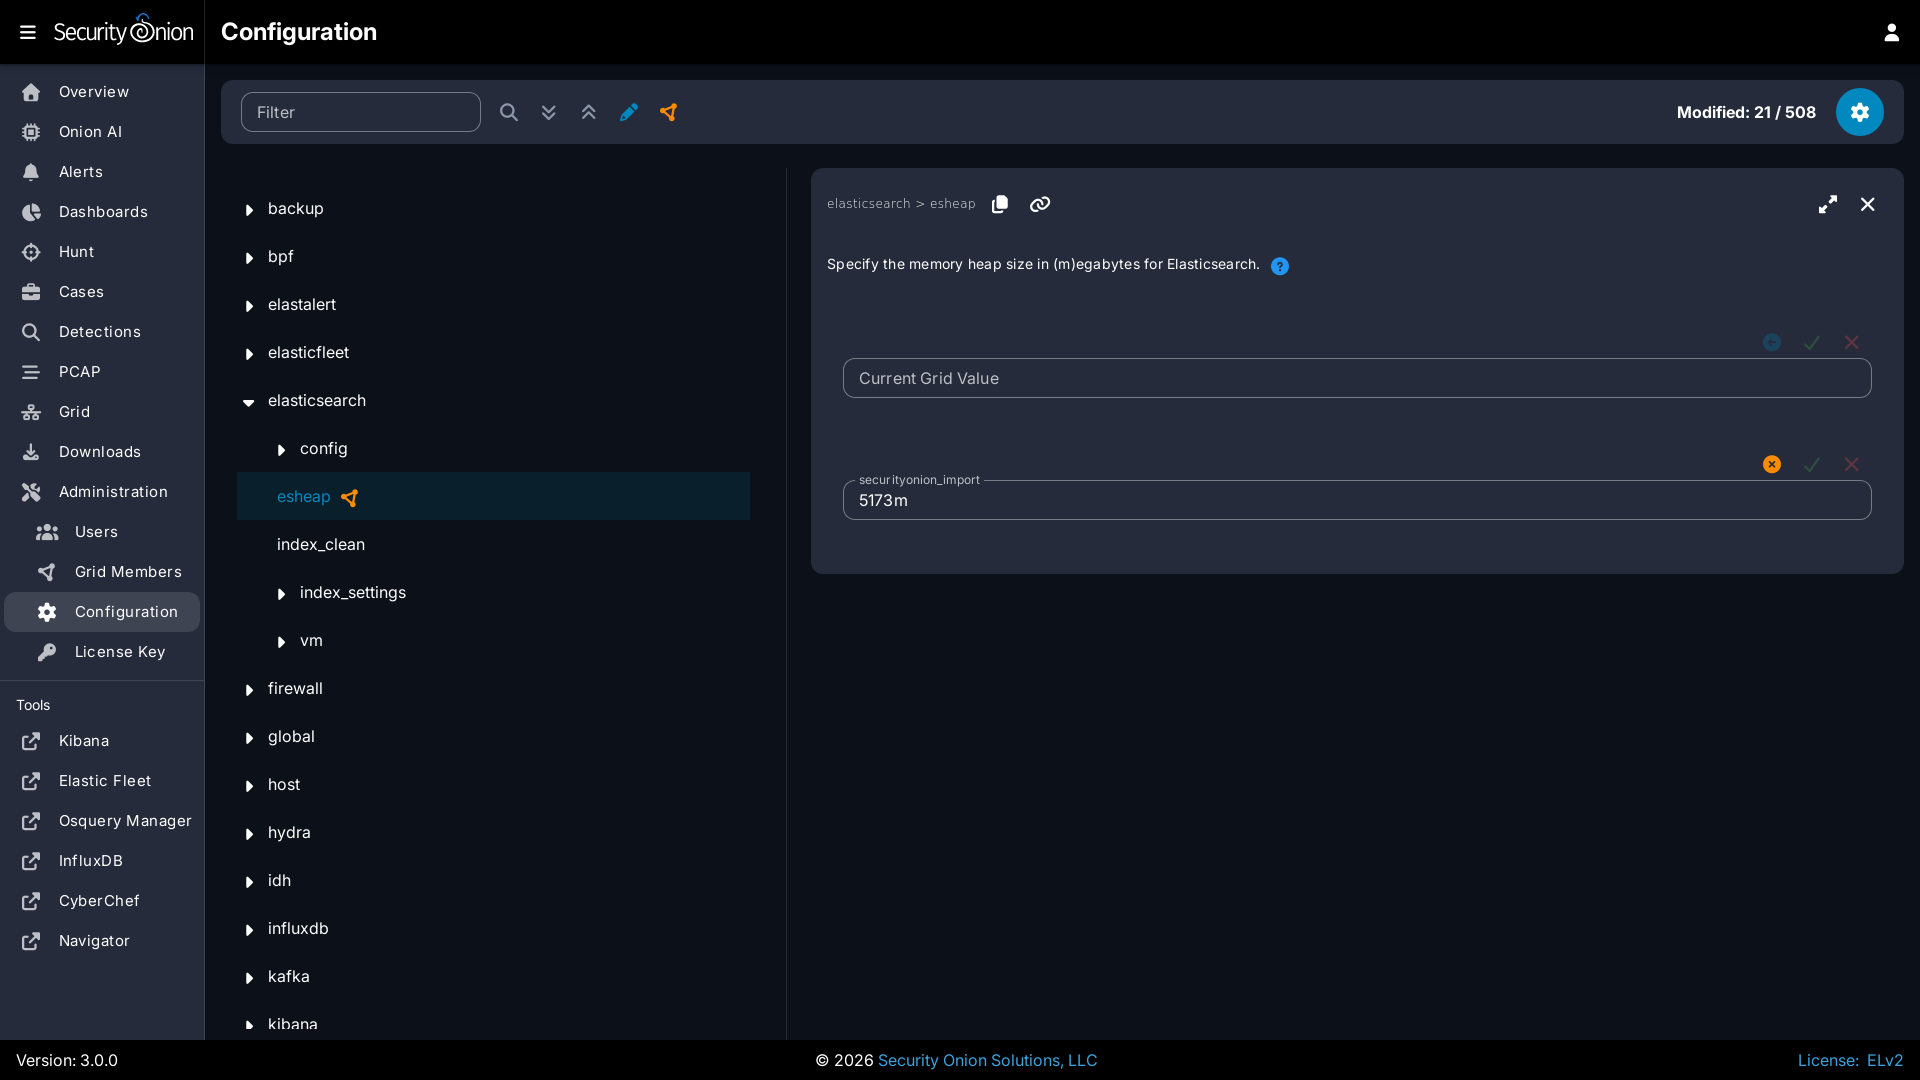
You can configure Elasticsearch by going to Administration --> Configuration --> Elasticsearch.
Parsing
Elasticsearch receives unparsed logs from Logstash or Elastic Agent. Elasticsearch then parses and stores those logs. Parsers are stored in /opt/so/conf/elasticsearch/ingest/. Custom ingest parsers can be placed in /opt/so/saltstack/local/salt/elasticsearch/files/ingest/. Auto State Apply picks these up within a few minutes. If you don't want to wait, apply the Elasticsearch state to all nodes running Elasticsearch:
Elastic Agent may pre-parse or act on data before the data reaches Elasticsearch, altering the data stream or index to which it is written, or other characteristics such as the event dataset or other pertinent information. This configuration is maintained in the agent policy or integration configuration in Elastic Fleet.
Note
You can learn more about Elasticsearch ingest parsing at: https://www.elastic.co/guide/en/elasticsearch/reference/current/ingest.html
Cluster
In a distributed deployment with a manager and one or more search nodes, the manager and search nodes are joined together as a multi-node Elastic cluster.
For more information, please see the cluster information at https://www.elastic.co/guide/en/elasticsearch/reference/current/modules-node.html#modules-node.
Elasticsearch Node Roles
Please see the Elasticsearch node roles documentation at https://www.elastic.co/guide/en/elasticsearch/reference/current/modules-node.html.
When building a distributed deployment, the Security Onion manager has to start off with the data node role. If you later join a separate search node, then you may want to migrate the data from the manager to the search node and then remove the data node role from the manager. For more information, please see:
If you want to set certain search nodes to the data_hot, data_warm, or data_cold roles, make sure you remove the data role from them. You will also want to ensure that data_content is assigned to your hot nodes.
Warning
Elasticsearch node roles is an advanced setting and you should be careful to avoid disruption to your cluster!
To see and modify Elasticsearch node roles, first navigate to Administration --> Configuration, click the Options menu at the top of the page, and enable the Show advanced settings option. Then navigate to Elasticsearch --> so_roles and select the desired role. Finally, navigate to config --> node --> roles and the list of roles should appear on the right side of the page.
Templates
Fields are mapped to their appropriate data type using templates. When making changes for parsing, it is necessary to ensure fields are mapped to a data type to allow for indexing, which in turn allows for effective aggregation and searching in Dashboards, Hunt, and Kibana. Elasticsearch leverages both component and index templates.
Note
For managing templates for third party integrations, please see the third-party-integrations section.
Component Templates
From https://www.elastic.co/guide/en/elasticsearch/reference/current/index-templates.html:
Component templates are reusable building blocks that configure mappings, settings, and aliases. While you can use component templates to construct index templates, they aren't directly applied to a set of indices. Also see https://www.elastic.co/guide/en/elasticsearch/reference/current/indices-component-template.html.
Index Templates
From https://www.elastic.co/guide/en/elasticsearch/reference/current/index-templates.html:
An index template is a way to tell Elasticsearch how to configure an index when it is created. Templates are configured prior to index creation. When an index is created - either manually or through indexing a document - the template settings are used as a basis for creating the index. Index templates can contain a collection of component templates, as well as directly specify settings, mappings, and aliases.
In Security Onion, component templates are stored in /opt/so/saltstack/default/salt/elasticsearch/templates/component/.
These templates are specified to be used in the index template definitions in /opt/so/saltstack/default/salt/elasticsearch/defaults.yml.
Community ID
For logs that don't naturally include Community ID, we use the Elasticsearch Community ID processor: https://www.elastic.co/guide/en/elasticsearch/reference/current/community-id-processor.html
field expansion matches too many fields
If you get errors like failed to create query: field expansion for [*] matches too many fields, limit: 3500, got: XXXX, then this usually means that you're sending in additional logs and so you have more fields than our default max_clause_count value. To resolve this, you can go to Administration --> Configuration --> Elasticsearch --> config --> indices --> query --> bool --> max_clause_count and adjust the value for any boxes running Elasticsearch in your deployment.
Shards
Here are a few tips from https://www.elastic.co/blog/how-many-shards-should-i-have-in-my-elasticsearch-cluster:
TIP: Avoid having very large shards as this can negatively affect the cluster's ability to recover from failure. There is no fixed limit on how large shards can be, but a shard size of 50GB is often quoted as a limit that has been seen to work for a variety of use-cases.
TIP: Small shards result in small segments, which increases overhead. Aim to keep the average shard size between a few GB and a few tens of GB. For use-cases with time-based data, it is common to see shards between 20GB and 40GB in size.
TIP: The number of shards you can hold on a node will be proportional to the amount of heap you have available, but there is no fixed limit enforced by Elasticsearch. A good rule-of-thumb is to ensure you keep the number of shards per node below 20 to 25 per GB heap it has configured. A node with a 30GB heap should therefore have a maximum of 600-750 shards, but the further below this limit you can keep it the better. This will generally help the cluster stay in good health.
To see your existing shards, run the following command and the number of shards will be shown in the fifth column:
If you want to view the detail for each of those shards:Given the sizing tips above, if any of your indices are averaging more than 50GB per shard, then you should probably increase the shard count until you get below that recommended maximum of 50GB per shard.
The number of shards for an index can be adjusted by going to Administration --> Configuration --> Elasticsearch --> index_settings --> so-INDEX-NAME --> index_template --> template --> settings --> index --> number_of_shards.
Please keep in mind that old indices will retain previous shard settings and the above settings will only be applied to newly created indices.
Heap Size
If total available memory is 8GB or greater, Setup configures the heap size to be 33% of available memory, but no greater than 25GB. You may need to adjust the value for heap size depending on your system's performance. You can modify this by going to Administration --> Configuration --> Elasticsearch --> esheap.
For more information, please see:
- https://www.elastic.co/guide/en/elasticsearch/guide/current/heap-sizing.html#compressed_oops
- https://www.elastic.co/guide/en/elasticsearch/reference/current/important-settings.html#heap-size-settings
Field limit
Security Onion currently defaults to a field limit of 5000. If you receive error messages from Logstash, or you would simply like to increase this, you can do so by going to Administration --> Configuration --> Elasticsearch --> index_settings --> so-INDEX-NAME --> index_template --> template --> settings --> index --> mapping --> total_fields --> limit.
Please note that the change to the field limit will not occur immediately, only on index creation.
Re-indexing
Re-indexing may need to occur if field data types have changed and conflicts arise. This process can be VERY time-consuming, and we only recommend this if keeping data is absolutely critical.
For more information about re-indexing, please see: https://www.elastic.co/guide/en/elasticsearch/reference/current/docs-reindex.html
Clearing
If you want to clear all Elasticsearch data including documents and indices, you can run the so-elastic-clear command.
GeoIP
Elasticsearch 8 no longer includes GeoIP databases by default. We include GeoIP databases for Elasticsearch so that all users will have GeoIP functionality. If your search nodes have Internet access and can reach geoip.elastic.co and storage.googleapis.com, then you can opt-in to database updates if you want more recent information. To do so, run the following command on your manager:
sudo so-elasticsearch-query _cluster/settings -d '{"persistent":{"ingest.geoip.downloader.enabled":true}}' -XPUT
Health
To check Elasticsearch health, go to the Grid interface and check the Elasticsearch Status field. If it shows anything other than OK, then run the following command from the CLI on the manager node to check for additional clues:
Status Pending
If the Grid interface shows Elasticsearch Status as Pending, check for unassigned shards by running the following command from the CLI on the manager node:
The result of the query should display affected indices. Older metrics indices for Elastic Endpoint logs may have been assigned a replica, so if you are running a single-node Elastic cluster there will be nowhere for the replica to exist.
To resolve the issue, run the following command for each affected index (replacing $index with the actual index name):
After running the command, the index should no longer use replicas and the status should change from "Pending" to "OK" once all indices have been successfully modified.
Index Management
Most Security Onion data is stored in Elasticsearch data streams. Starting with Security Onion 3.2.0, retention can be managed with either Data Stream Lifecycle Management (DLM) or Index Lifecycle Management (ILM). When using ILM, retention is also managed by the so-elasticsearch-indices-delete utility.
| Scenario | DLM | ILM |
|---|---|---|
| Fresh 3.2.0 install | Default and recommended | Choose only for advanced needs |
| SOUP'ed grid | Can manually switch to DLM | Default remains on ILM |
For most deployments, DLM provides sufficient retention management with low configuration overhead. Choose ILM when data should automatically move between data tiers. For example, a distributed grid may use search nodes with SSD or NVMe storage as the 'hot' data tier for recent, frequently searched data, then move older data to warm or cold nodes with lower-cost storage.
| Requirement | DLM | ILM |
|---|---|---|
| Straightforward time-based retention | ✅ | - |
| Minimal overall configuration | ✅ | ⚠️ Requires additional configuration |
| Move older data to warm or cold tiers | ❌ | ✅ |
| Set shard count or replica count as data ages | ❌ | ✅ |
| Apply lifecycle actions at different data ages | ❌ | ✅ |
| Advanced phase actions | ⚠️ Limited actions supported | ✅ |
DLM
Data Stream Lifecycle Management (DLM) applies a retention period directly to a data stream. Retention here is defined as the time period for which your data is guaranteed to be stored (assuming enough storage is allocated to Elasticsearch). Elasticsearch is allowed at a later time to delete data older than this time period. Retention can be configured on the data stream level or on a global level.
New Security Onion 3.2.0 grids use DLM by default. DLM is the recommended choice for single-node deployments and most distributed grids because it allows for the most straightforward configuration, eliminating the need to configure more complex ILM policies. Security Onion data streams use a 90-day retention period by default.
Warning
Existing grids will remain on ILM. Only fresh installs of Security Onion 3.2.0 will default to using DLM.
View or configure retention method
The retention method can be set to either DLM or ILM. Changing this value updates all managed index templates & data streams to use the configured retention method.
- In SOC, go to Administration --> Configuration --> Elasticsearch.
- Select data_retention_method to view the current method.
- Select
DLMto use Data Stream Lifecycle Management, or selectILMto use Index Lifecycle Management.
When the grid synchronizes, selecting DLM enables DLM lifecycle retention for supported Security Onion data streams. Selecting ILM disables DLM lifecycle retention for those streams and returns their retention management to ILM.
Before switching methods, review your data-retention requirements and available Elasticsearch storage. In deployments where disk-space-based index cleanup is available with ILM, that cleanup is not used with DLM. Make sure the configured DLM retention periods and available storage leave sufficient free space; otherwise, Elasticsearch can stop ingesting data when disk watermarks are reached.
Warning
Before switching from ILM to DLM, verify the current Elasticsearch node roles configuration. You'll want to ensure that all Elasticsearch nodes have the data or data_hot role. As DLM rolls over data streams, they'll be created with _tier_preferences: data_hot.
Note
When using DLM as your retention method, the so-elasticsearch-indices-delete script is disabled. Retention settings for DLM will need to be configured appropriately to maintain storage usage below the configured watermark.
Configure retention setting
DLM retention can be managed globally and per data stream. Once configured, the index template(s) will be updated and if a data stream currently exists, it will be updated with the newly configured retention period. Data stream retention is updated in place using the so-elasticsearch-dlm-apply script.
To update the global retention period value:
- In SOC, go to Administration --> Configuration --> Elasticsearch
- Select index_settings --> global_overrides --> data_stream_lifecycle --> data_retention
To update data stream specific retention:
- In SOC, go to Administration --> Configuration --> Elasticsearch
- Select index_settings
- Locate the target data stream (for example, so-zeek)
- If the target data stream is not listed, you may need to first update managed_integrations
- Select so-zeek --> data_stream_lifecycle --> data_retention
Note
The retention period directly affects how frequently a data stream is automatically rolled over.
If retention is less than or equal to 1 day, max_age will be 1 hour.
If retention is less than or equal to 14 days, max_age will be 1 day
If retention is less than or equal to 90 days, max_age will be 7 days
If retention is greater than 90 days, max_age will be 30 days
Tuning the value of cluster.lifecycle.default.rollover allows for more control over how frequently a given data stream is rolled over.
DLM advanced configuration
cluster.lifecycle.default.rollover
This property accepts a key value pair formatted string and configures the conditions that would trigger a data stream to rollover when it has lifecycle configured.
- In SOC, go to Administration --> Configuration --> Elasticsearch
- Select config --> cluster --> lifecycle --> default --> rollover
data_streams.lifecycle.poll_interval
How often Elasticsearch checks what the next action is for all data streams with a built-in lifecycle.
- In SOC, go to Administration --> Configuration --> Elasticsearch
- Select config --> data_streams --> lifecycle --> poll_interval
data_streams.lifecycle.target.merge.policy.merge_factor
Data stream lifecycle implements tail merging by updating the Lucene merge policy factor for the target backing index. The merge factor is both the number of segments that should be merged together, and the maximum number of segments that we expect to find on a given tier.
- In SOC, go to Administration --> Configuration --> Elasticsearch --> config
- Select data_streams --> lifecycle --> target --> merge --> policy --> merge_factor
data_streams.lifecycle.target.merge.policy.floor_segment
Data stream lifecycle implements tail merging by updating the Lucene merge policy floor segment for the target backing index. This floor segment size is a way to prevent indices from having a long tail of very small segments.
- In SOC, go to Administration --> Configuration --> Elasticsearch --> config
- Select data_streams --> lifecycle --> target --> merge --> policy --> floor_segment
so-elasticsearch-indices-delete
so-elasticsearch-indices-delete manages size-based deletion of Elasticsearch indices based on the value of the Elasticsearch.retention.retention_pct setting. This setting is checked against the total disk space available for /nsm/elasticsearch across all nodes in the Elasticsearch cluster. If your indices are using more than retention_pct, then so-elasticsearch-indices-delete will delete old indices until disk space consumed by indices is back under retention_pct. The default value for this setting is 50 percent so that standalone deployments have sufficient space for not only Elasticsearch but also full packet capture and other logs. For distributed deployments with dedicated search nodes where Elasticsearch is main consumer of disk space, you may want to increase this default value.
To modify the retention_pct value, first navigate to Administration --> Configuration. At the top of the page, click the Options menu and then enable the Show advanced settings option. Then navigate to Elasticsearch --> retention --> retention_pct. Once you make the change and save it, Auto State Apply should apply the new setting within a few minutes.
ILM
Index Lifecycle Management (ILM) manages the following:
- size-based index rollover
- time-based index rollover
- time-based content tiers
- time-based index deletion
Time-based index deletion is based on the min_age setting within the global policy or the individual policy for the index itself. Please note that size-based deletion via so-elasticsearch-indices-delete takes priority over time-based deletion, as disk usage may reach retention_pct and indices will be deleted before the min_age value is reached.
ILM settings can be found by navigating to Administration --> Configuration --> Elasticsearch --> index_settings:
- To edit the global policy that applies to ALL indices, navigate to global_overrides --> policy --> phases and there you will see the cold, delete, hot, and warm ILM phases.
- To edit the policy for an individual index, first click the
Optionsmenu at the top of the page and then enable theShow advanced settingsoption. Then navigate to $index --> policy --> phases. There you will see the cold, delete, hot, and warm ILM phases for that particular index. - It's important to note that settings like
min_ageare calculated relative to the rollover date (NOT the original creation date of the index). For example, if you have an index that is set to rollover after 30 days and deletemin_ageis set to 30 then there will be 30 days from index creation to rollover and then an additional 30 days before deletion. - When modifying ILM settings, note that some settings will only take effect after a new index is created.
Now that you have an overview of all that ILM can do, here's a very high level overview of how you would configure ILM deletion for your deployment:
- Determine your data retention requirements. This might be 1 week, 1 month, or more. It may also be different for different kinds of data.
- Determine your current daily ingestion. One way to do this is to go to Kibana, select the menu on the left, select Stack Management, and then go to Index Management to see what your current indices look like. Another option is to run
sudo so-elasticsearch-indices-growthfrom the command line. - Now that you have your data retention requirements and current daily ingestion, use those values to determine your storage requirements. Keep in mind that Elasticsearch's default watermark setting of 80% means that you will want to keep 20% of your disk free and this will need to be accounted for in your storage requirements. If your storage requirements are greater than the amount of storage that you have available, then you may need to add additional search nodes.
- Configure ILM Deletion to delete logs before hitting the Elasticsearch 80% watermark. This can be done globally for all indices by going to Administration -> Configuration -> Elasticsearch > index_settings > global_overrides > policy > phases > delete > min_age. Again, keep in mind that the
min_agesetting is calculated relative to the index rollover date and NOT the original creation date of the index. If you want to specify different deletion values for different kinds of data, then you can enable advanced settings and then drill into specific policies to do so.
Tip
You might want to run sudo so-elasticsearch-indices-growth on a regular basis to keep an eye on the size of your indices.
In addition to sudo so-elasticsearch-indices-growth, you can also run sudo so-elasticsearch-retention-estimate which will give you an approximation of how many days' worth of logs you can store. For example:
DISCLAIMER: Script output is based on current data patterns, but are approximations solely
  intended to assist with getting a general ILM policy configured.

================ Storage Overview ================

Indexed data size:       141.12 GB (Elasticsearch)
Cluster capacity:        498.69 GB total
Cluster used:            245.32 GB
Low watermark:           80% (398.96 GB threshold)
Remaining space:         153.63 GB before low watermark
Cluster shards:          498 / 4000 (12.4%)
Cluster data nodes:      4
  example-search1: data_hot,data_warm,data_content
  example-search2: data_hot,data_warm,data_content
  example-search3: data_cold
  example-man: data_content

================ ES Growth ================

Daily growth rate:       4.08 GB/day
ILM deletion rate:       0.47 GB/day (scheduled)
Net growth rate:         3.62 GB/day
Daily shard creation:    ~3 shards/day
Storage to be freed (30d): 2 indices (~13.97 GB, 4 shards)

================ Retention Projection ================

Oldest index:            ~55 days (.ds-logs-auditd_manager.auditd-default-2025.09.30-000001)
Estimated retention:     ~98 days (until configured low watermark setting)

 Low watermark breach estimated in ~42.47 days (2026-01-06)
For maximum retention, our goal is to get the cluster balanced as close to the low watermark setting as possible. In this example, it appears the cluster is gaining about 4GB worth of logs per day. However, ILM is currently deleting roughly 0.5GB per day, so overall storage usage is increasing. Without tweaking ILM configuration, this cluster will hit the watermark in roughly 42 days (total retention being roughly 98 days). To combat this, one option is to set a global_overrides for the delete phase as described above setting the delete phase to something like 90 days. This gives us a bit of space between the estimated retention and our actual delete phase.
In addition to global overrides, which apply to all indices, it is possible to tweak per index ILM policies. For example, perhaps Suricata alert data is something you need to keep in storage for 120 days. You can configure the so-suricata.alerts policy to have a delete phase of 120d. This comes at the cost of needing to reduce retention on other indices in order to free up the needed storage for Suricata alerts.
Tip
Once you have ILM configured, you can consider increasing the cluster low / high watermark settings to allow Elasticsearch to use more of the available disk space. This can be done by going to Administration --> Configuration --> Elasticsearch --> config --> cluster --> routing --> allocation --> disk --> watermark.
Note
You can learn more about ILM at: https://www.elastic.co/guide/en/elasticsearch/reference/current/index-lifecycle-management.html
Diagnostic Logging
- Elasticsearch logs can be found in
/opt/so/log/elasticsearch/. - Logging configuration can be found in
/opt/so/conf/elasticsearch/log4j2.properties.
Depending on what you're looking for, you may also need to look at the Docker logs for the container:
More Information
Note
For more information about Elasticsearch, please see: https://www.elastic.co/products/elasticsearch