pfSense
pfSense is a free and open firewall that can be found at https://www.pfsense.org/. There are a few different ways in which you can integrate pfSense into your Security Onion deployment.
The simplest method of integrating pfSense into your Security Onion deployment is to configure pfSense to send its firewall logs to Security Onion. Security Onion has a couple of options for ingesting logs from pfSense firewalls: a simple parser and the more comprehensive Elastic Integration for pfSense. We recommend using the more comprehensive option by following the steps in the Elastic Integration section below. You can also follow along with our video at https://www.youtube.com/watch?v=aoH8qZwAxek.
You can also configure pfSense to send NetFlow data to your Security Onion deployment. This may provide some additional visibility if you can’t deploy a full Security Onion network sensor to monitor that network segment.
Simple Parser
The first option for collecting pfSense firewall logs is to use our simple parser. Please note that this only supports filterlog (actual firewall logs) and no other logs.
Warning
This simple parser will be phased out over time in favor of the more comprehensive Elastic Integration for pfSense below.
To use the simple parser, first go to Administration –> Configuration –> firewall –> hostgroups.
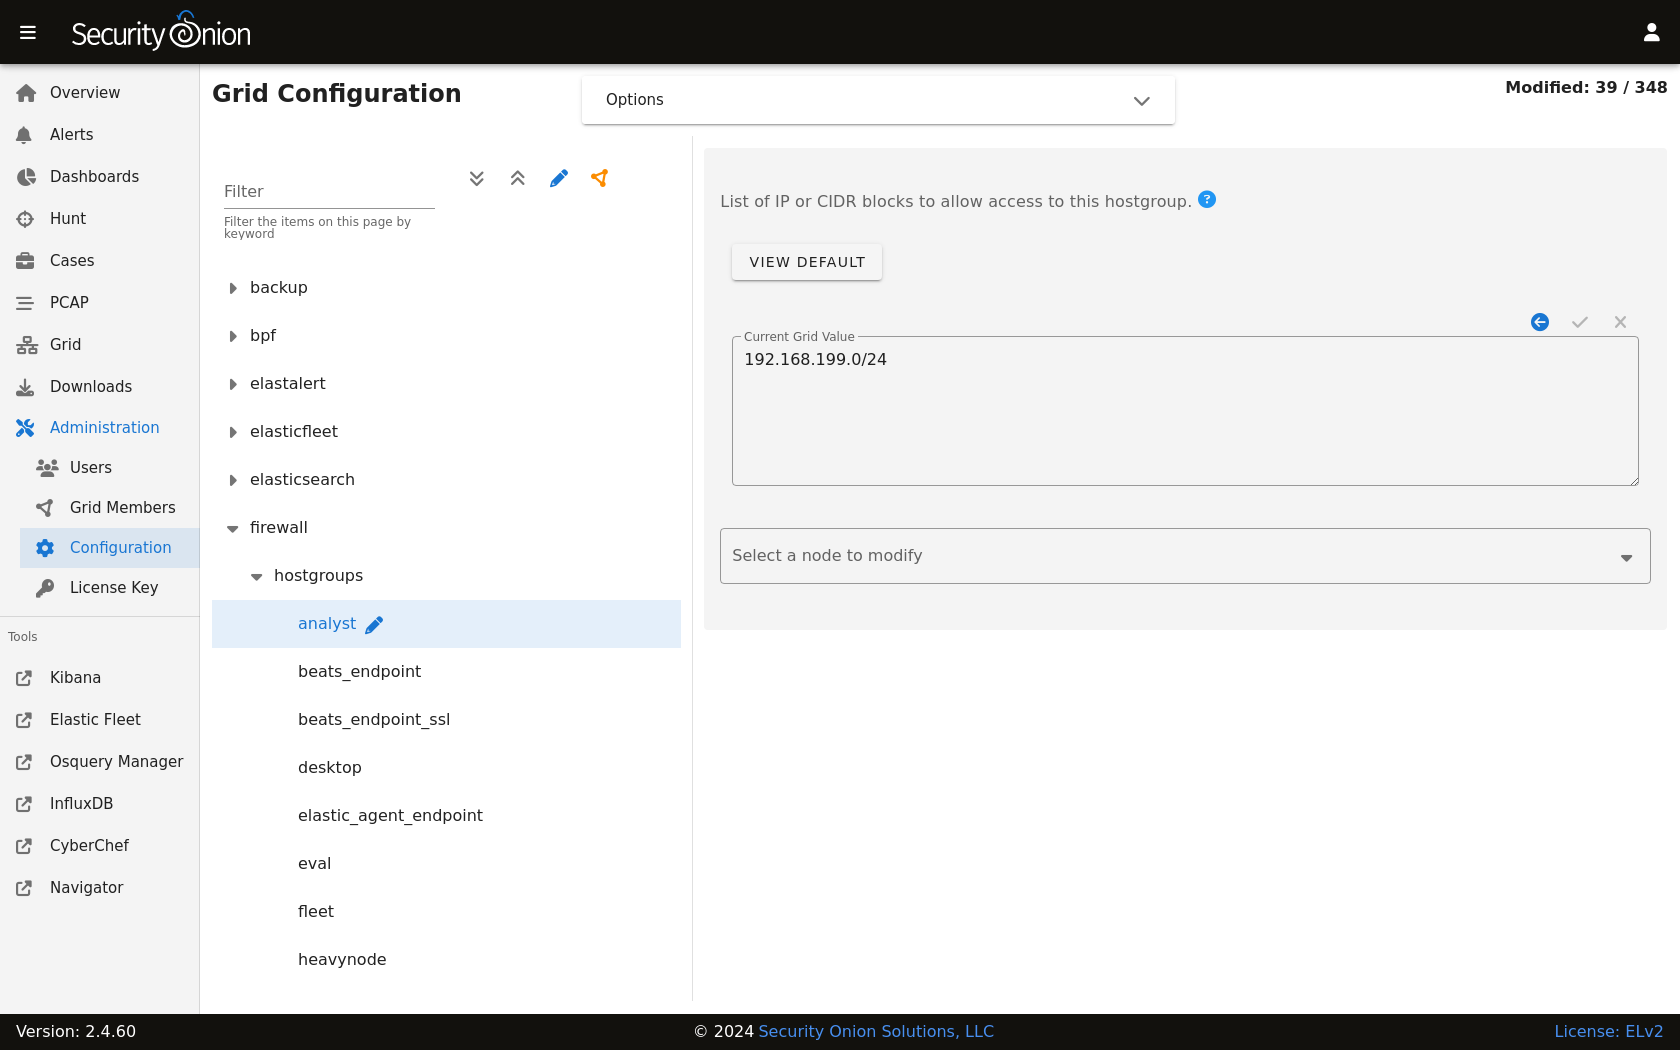
Once there, select the syslog option, specify the IP address of the pfSense firewall, and click the checkmark to save. Then click the SYNCHRONIZE GRID button under the Options menu at the top of the page.
Next, configure your pfSense firewall to send syslog to the IP address of your Security Onion box. If you are using pfSense 2.6.0 or higher, make sure that Log Message Format is set to BSD (RFC 3164, default).
Once all configuration is complete, you should be able to go to Dashboards and select the Firewall dashboard to see your firewall logs.
Elastic Integration for pfSense
The second option for collecting pfSense firewall logs is using the Elastic Integration for pfSense (https://docs.elastic.co/integrations/pfsense). This integration is more comprehensive than the simple parser above and supports more log types.
First, add the pfSense integration and configure the pfSense firewall:
Go to Elastic Fleet, click the
Agent policiestab, and then click the desired policy (for exampleso-grid-nodes_general).Click the
Add integrationbutton.Search for
pfSenseand then click on thepfSenseintegration.The Elastic Integration page will show instructions for configuring pfSense. Follow these instructions but please note that the Elastic Integration expects to receive pfSense logs on port 9001 by default.
Once you’ve configured pfSense, then go back to the Elastic screen and click the
Add pfSensebutton.On the
Edit pfSense integrationscreen, go to theSyslog Hostfield and changelocalhostto0.0.0.0.Click the
Save and continuebutton and then clickSave and deploy changes.
Next, allow the traffic from the pfSense firewall to port 9001. These instructions assume that this is the first firewall change you have made and therefore refer to customhostgroup0 and customportgroup0. If those have already been used, select the next available hostgroup and portgroup.
Navigate to Administration –> Configuration.
At the top of the page, click the
Optionsmenu and then enable theShow advanced settingsoption.On the left side, go to
firewall, selecthostgroups, and click thecustomhostgroup0group. On the right side, enter the IP address of the pfSense firewall and click the checkmark to save.On the left side, go to
firewall, selectportgroups, select thecustomportgroup0group, and then clickudp. On the right side, enter9001and click the checkmark to save.On the left side, go to
firewall, selectrole, and then select the node type that will receive the pfSense logs. Then drill intochain–>INPUT–>hostgroups–>customhostgroup0–>portgroups. On the right side, entercustomportgroup0and click the checkmark to save.If you would like to apply the rules immediately, click the
SYNCHRONIZE GRIDbutton under theOptionsmenu at the top of the page.
Once all configuration is complete, you should be able to go to Dashboards and select the Firewall - pfSense dashboard to see your firewall logs.