Elastic Agent
From https://www.elastic.co/elastic-agent:
With Elastic Agent you can collect all forms of data from anywhere with a single unified agent per host. One thing to install, configure, and scale.
Each Security Onion node uses the Elastic Agent to transport logs to Elasticsearch. You can also deploy the Elastic Agent to your endpoints to transport logs to your Security Onion deployment.
Note
In order to receive logs from the Elastic Agent, Security Onion must be running Logstash. Evaluation Mode and Import Mode do not run Logstash, so you’ll need Standalone or a full Distributed Deployment. In a Distributed Deployment, sensor nodes do not run Logstash, so you’ll need to configure agents to send to your manager or receiver nodes. For more information, please see the Architecture section.
To deploy an Elastic agent to an endpoint, go to the Security Onion Console (SOC) Downloads page and download the proper Elastic agent for the operating system of that endpoint.
Warning
Within the Elastic Fleet interface, there is an Add Agent button - it is not recommended to use this particular method to install the Elastic Agent, as it requires much more manual configuration.
Don’t forget to allow the agent to connect through the firewall by going to Administration –> Configuration –> firewall –> hostgroups.
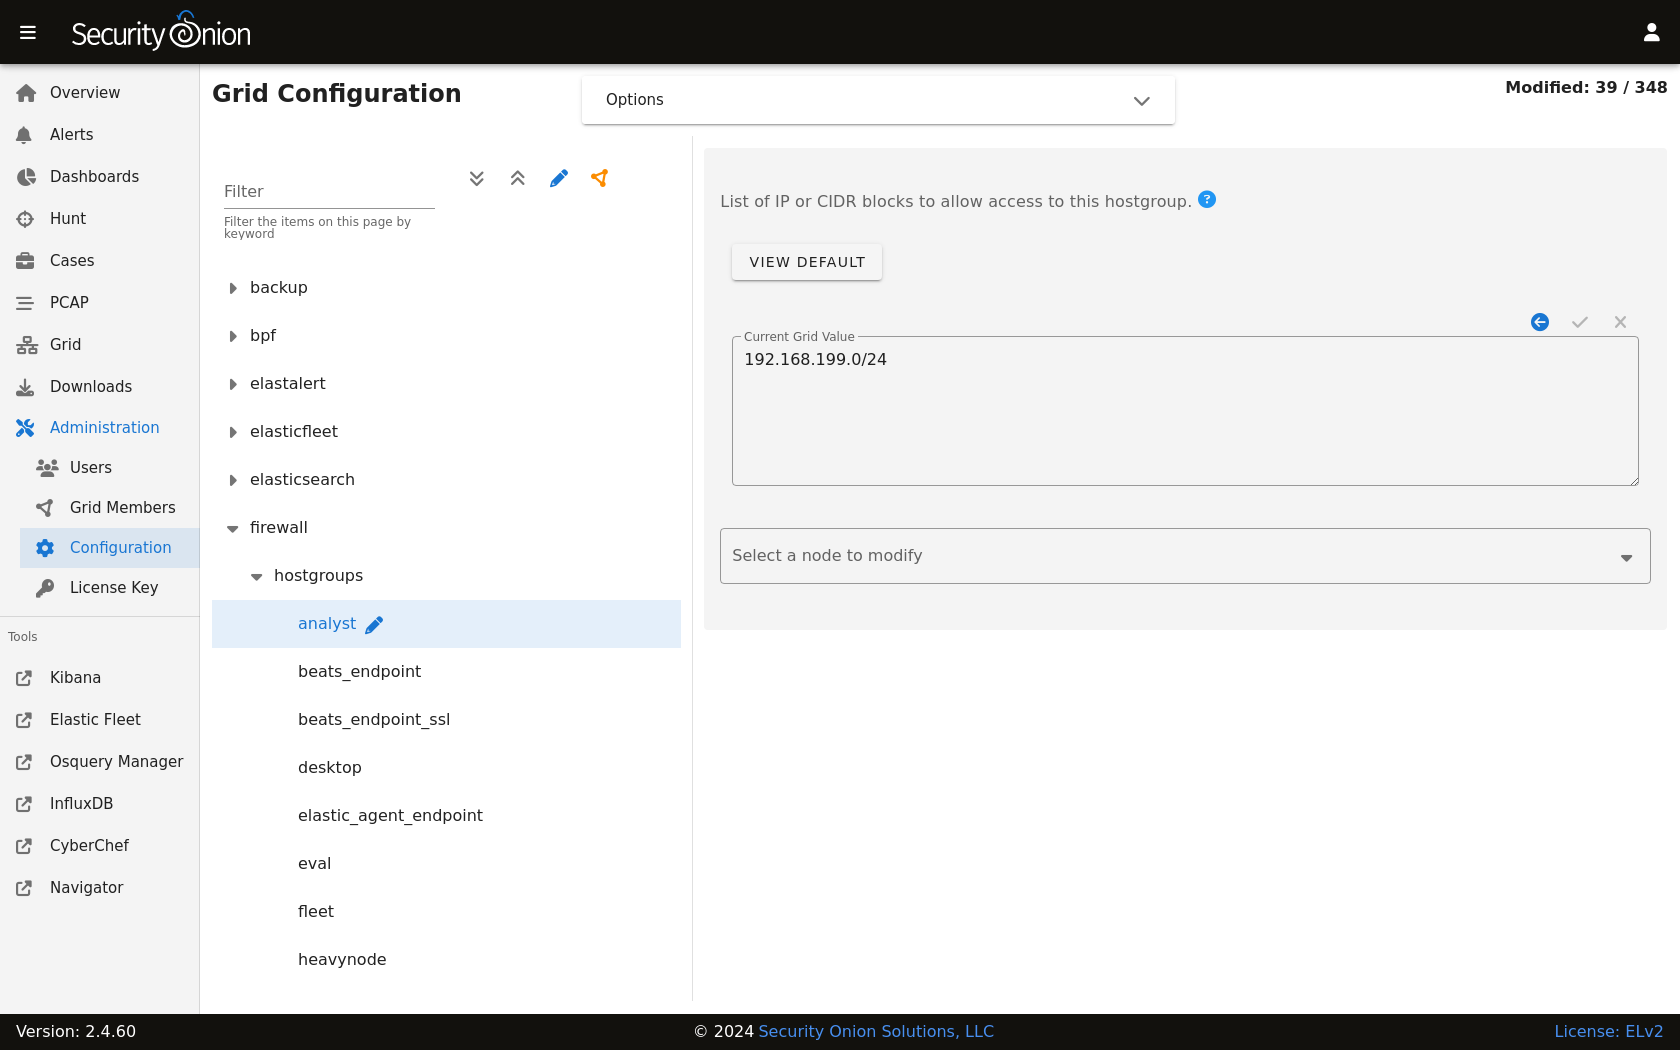
Once there, select the elastic_agent_endpoint option.
Note
Check out our Elastic Agent video at https://youtu.be/cGmQMsFuAvw!
Elastic Agent Options (Non-MSI)
There are additional installer runtime options:
-token=$TOKEN
This option allows you to override the agent policy that the installer uses by default. The token comes from the Elastic Fleet interface under Enrollment Tokens.
-fleet=$FLEETHOST
This option allows you to override the default Fleet host used for enrollment.
-delay-enroll=true|false
Defaults to false. If set to true, it adds the builtin delay-enroll flag when enrolling the agent.
-timeout=$MINUTES
Defaults to 5 minutes.
Elastic Agent Options (MSI)
When using the MSI installer runtime options are:
TOKEN=$TOKEN
This option allows you to override the agent policy that the installer uses by default. The token comes from the Elastic Fleet interface under Enrollment Tokens.
FLEET=$FLEETHOST
This option allows you to override the default Fleet host used for enrollment.
DELAYENROLL=true|false
This option allows you to override the default Fleet host used for enrollment.
TIMEOUT=$MINUTES
Defaults to 5 minutes.
Installing Elastic Agent on Linux
If deploying the Elastic Agent to a Linux host, make the file executable and then execute using sudo:
chmod +x ./so-elastic-agent_linux_amd64
sudo ./so-elastic-agent_linux_amd64
Installing Elastic Agent on MacOS
If deploying the Elastic Agent to macOS, you will need to take a few steps. First, remove the quarantine attribute. Then, make the file executable. Finally, execute the file using sudo:
xattr -d com.apple.quarantine ./so-elastic-agent_darwin_amd64
chmod +x ./so-elastic-agent_darwin_amd64
sudo ./so-elastic-agent_darwin_amd64
After the installer has completed, review the Elastic docs for your version of macOS and approve the required settings (system extension and full drive access) as shown at https://www.elastic.co/guide/en/security/current/elastic-endpoint-deploy-reqs.html.
Installing Elastic Agent on Windows via MSI
When deploying via MSI, installation can be as simple as double-clicking the MSI installer. If you require additional runtime flags, use msiexec /i :
msiexec /i so-elastic-agent_windows_amd64_msi TOKEN=$TOKEN TIMEOUT=10m
Logs
Once the agent starts sending logs, you should be able to find them in Dashboards, Hunt, or Kibana.
Management
You can manage your agents using Elastic Fleet.
Live Queries
You can query your agents in realtime using Osquery Manager.
Integrations
You can read more about integrations in the Elastic Fleet section and at https://docs.elastic.co/integrations.
Reinstalling
If for some reason you need to uninstall and reinstall the Elastic Agent on one of your Security Onion grid members, you can do so as follows:
sudo elastic-agent uninstall
sudo salt-call state.apply elasticfleet.install_agent_grid
More Information
Note
For more information about the Elastic Agent, please see https://www.elastic.co/guide/en/fleet/current/fleet-overview.html.